About

What to know
- The majority of U.S. adults report satisfaction with their lives. Life satisfaction is defined as "the extent to which a person finds life rich, meaningful, full, or of high quality."1
- However, daily experiences of poor mental health are common among youth and adults.
- Physical and mental health are closely related and can influence one another. Taking care of physical health may improve aspects of mental health and vice versa. Taking steps to improve both physical and mental health can improve overall well-being.
- Many factors influence both physical and mental health, including one's environment, stressors, family and social relationships, coping skills, and health care access. Improving the conditions where we live, learn, work, and play can make a difference in people's health.
Adult life satisfaction data

National: Adult life satisfaction
Most recent 2023 data show 96% of U.S. adults were very satisfied or satisfied with their lives.
By state: Adult life satisfaction
Percentage of U.S. adults by state or territory who were very satisfied or satisfied with their lives.
Youth mental health status data
National & by state: Youth reporting poor mental health
Most recent 2023 data show 29% or 1 in 3 U.S. high school students reported their mental health was not good most of the time or always during the past 30 days. Poor mental health included stress, anxiety, and depression. The percentage did not statistically differ from 2021 to 2023.

Adult physical health and mental health status data
By state: Adults reporting poor physical health
Percentage of adults by U.S. state or territory who reported that their physical health, including physical illness and injury, was not good for 14 or more days during the past 30 days.
By state: Adults reporting poor mental health
Percentage of adults by U.S. state or territory who reported that their mental health, including stress, depression, and problems with emotions, was not good for 14 or more days during the past 30 days.
These percentages are ranked and classified into four groups: 0-25th percentile, 26-50th percentile, 51-75th percentile, and 76-100th percentile. The percentiles allow for comparison between states or territories.
By state: Adults unable to participate in usual activities due to health
Percentage of adults by U.S. state or territory who reported that poor physical or mental health kept them from usual activities such as self-care, work, or recreation during the past 30 days.

Notice
CI = Confidence interval of 95% indicates that 95% of the time, the value is expected to fall within this estimated range.
For statistical tests used, refer to data notes.
Explore original data source tools
- Behavioral Risk Factor Surveillance System (BRFSS) Prevalence and Trends Tool displays data on health-related risk behaviors, chronic health conditions, and use of preventive services. Toggle within the State & Territories or the Data by Topic dropdown menus to view these measures.
- National Health Interview Survey (NHIS) interactive dashboard displays data on anxiety, depression, and mental health care. Toggle within the topic dropdown in the tool to view these measures.
- NHIS-Teen interactive dashboard displays data on stressful life events, mental health care, bullying, and social and emotional support. Toggle within the topic dropdown in the tool to view these measures.
- Youth Risk Behavior Surveillance System (YRBS) Explorer displays data on mental health, social and emotional support, bullying, racism, suicide, and social media use. You can select Other Health Topics and Unintentional Injuries and Violence buttons in the tool to view these measures.
- American Psychological Association. (2022). APA Dictionary of Psychology - Life Satisfaction. https://dictionary.apa.org/life-satisfaction
- Swedo, E.A., Pampati, S., Anderson, K.N., et al. (2024). Adverse Childhood Experiences and Health Conditions and Risk Behaviors Among High School Students — Youth Risk Behavior Survey, United States, 2023. Morbidity and Mortality Weekly Report Suppl 73(4), 39–49. DOI: http://dx.doi.org/10.15585/mmwr.su7304a5
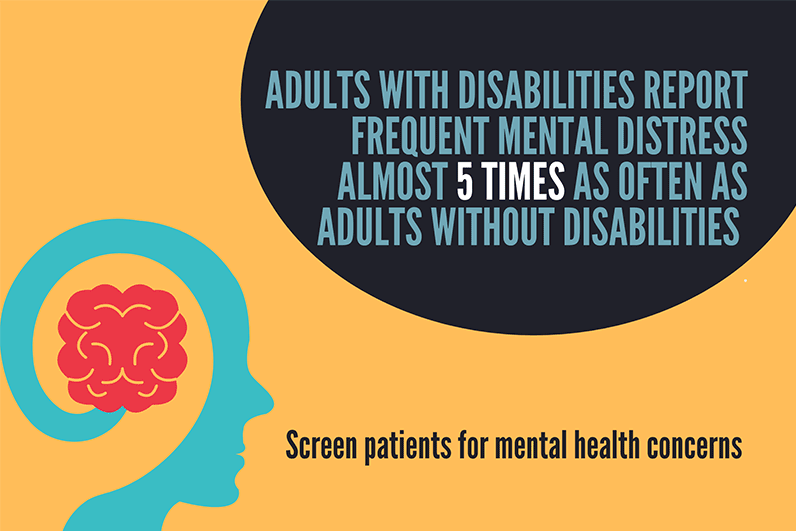
- Cree, R.A., Okoro, C.A., Zack, M.M., Carbone, E. (2020). Frequent Mental Distress Among Adults by Disability Status, Disability Type, and Selected Characteristics – United States 2018. Morbidity and Mortality Weekly Report 69(36);1238–1243. http://dx.doi.org/10.15585/mmwr.mm6936a2